Points of Interest
Either provide an adress, or use our search engine to find Points of Interest. Visualize them on a map, and see how far they are, and how to get to them. ...

Health Risks
View Historical and live Air Quality data. Select the polluant, year, and average type to ensure you're not exposed to unnecessary risks. The Noise Pollution map is a good first indicator, but make sure to verify on site. Noise levels can change a lot throughout the year (especially in the Winter when vegetation absorbs less noise). Georisks can point you to polluants in the soil, as well as life threatening risks.

Price
View Historical sales data for the asset you're analyzing, or neighbouring ones to help you estimate the price better. Use the financial projections tool to better understand the real costs.

Climate
View Historical Climate data for the asset you're analyzing. The number of rainy days, the average downpour etc.. The same goes for the sun as well as the snow. You'll also get average first and last frost dates. Estimates of soil temperature and moisture at various depths is also available.

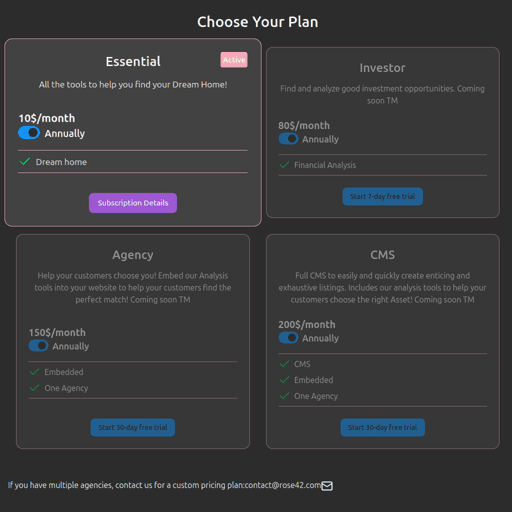
Billing
Billing is handled through Clerk. You can choose monthly or annual subscriptions. Review your current subscription under: User Menu > Pricing